Unemployment to Reemployment Portal
Overview
Powered by the Midwest Data Collaborative, the Unemployment to Reemployment interactive data visualization tool utilizes de-identified Unemployment Insurance claims data to create real-time labor market information critical for local pandemic response.
Developed during the COVID-19 Pandemic to address the employment crisis, this data tool allows policymakers and researchers to understand their state data and effectively respond to local and social economic challenges.
This interactive tool speaks to the potential of developing cross-state data infrastructures that can collect administrative data, enable the sharing of evidence-based practices, and allow for the establishment of common measures and research tools. In the past couple of years, a coalition of stats has built such an infrastructure through the Midwest Data Collaborative. The Collaborative is currently sharing data and products to understand their local economies and labor markets while developing insights for reemployment and recovery.
Process and Work
States in the Midwest Collaborative are working across state borders to create real-time labor market information critical for local pandemic response. Through the portal visualizations, state staff can:
- Easily identify which local labor markets and categories of workers are being hardest hit by the pandemic.
- Estimate the economic impacts of job loss.
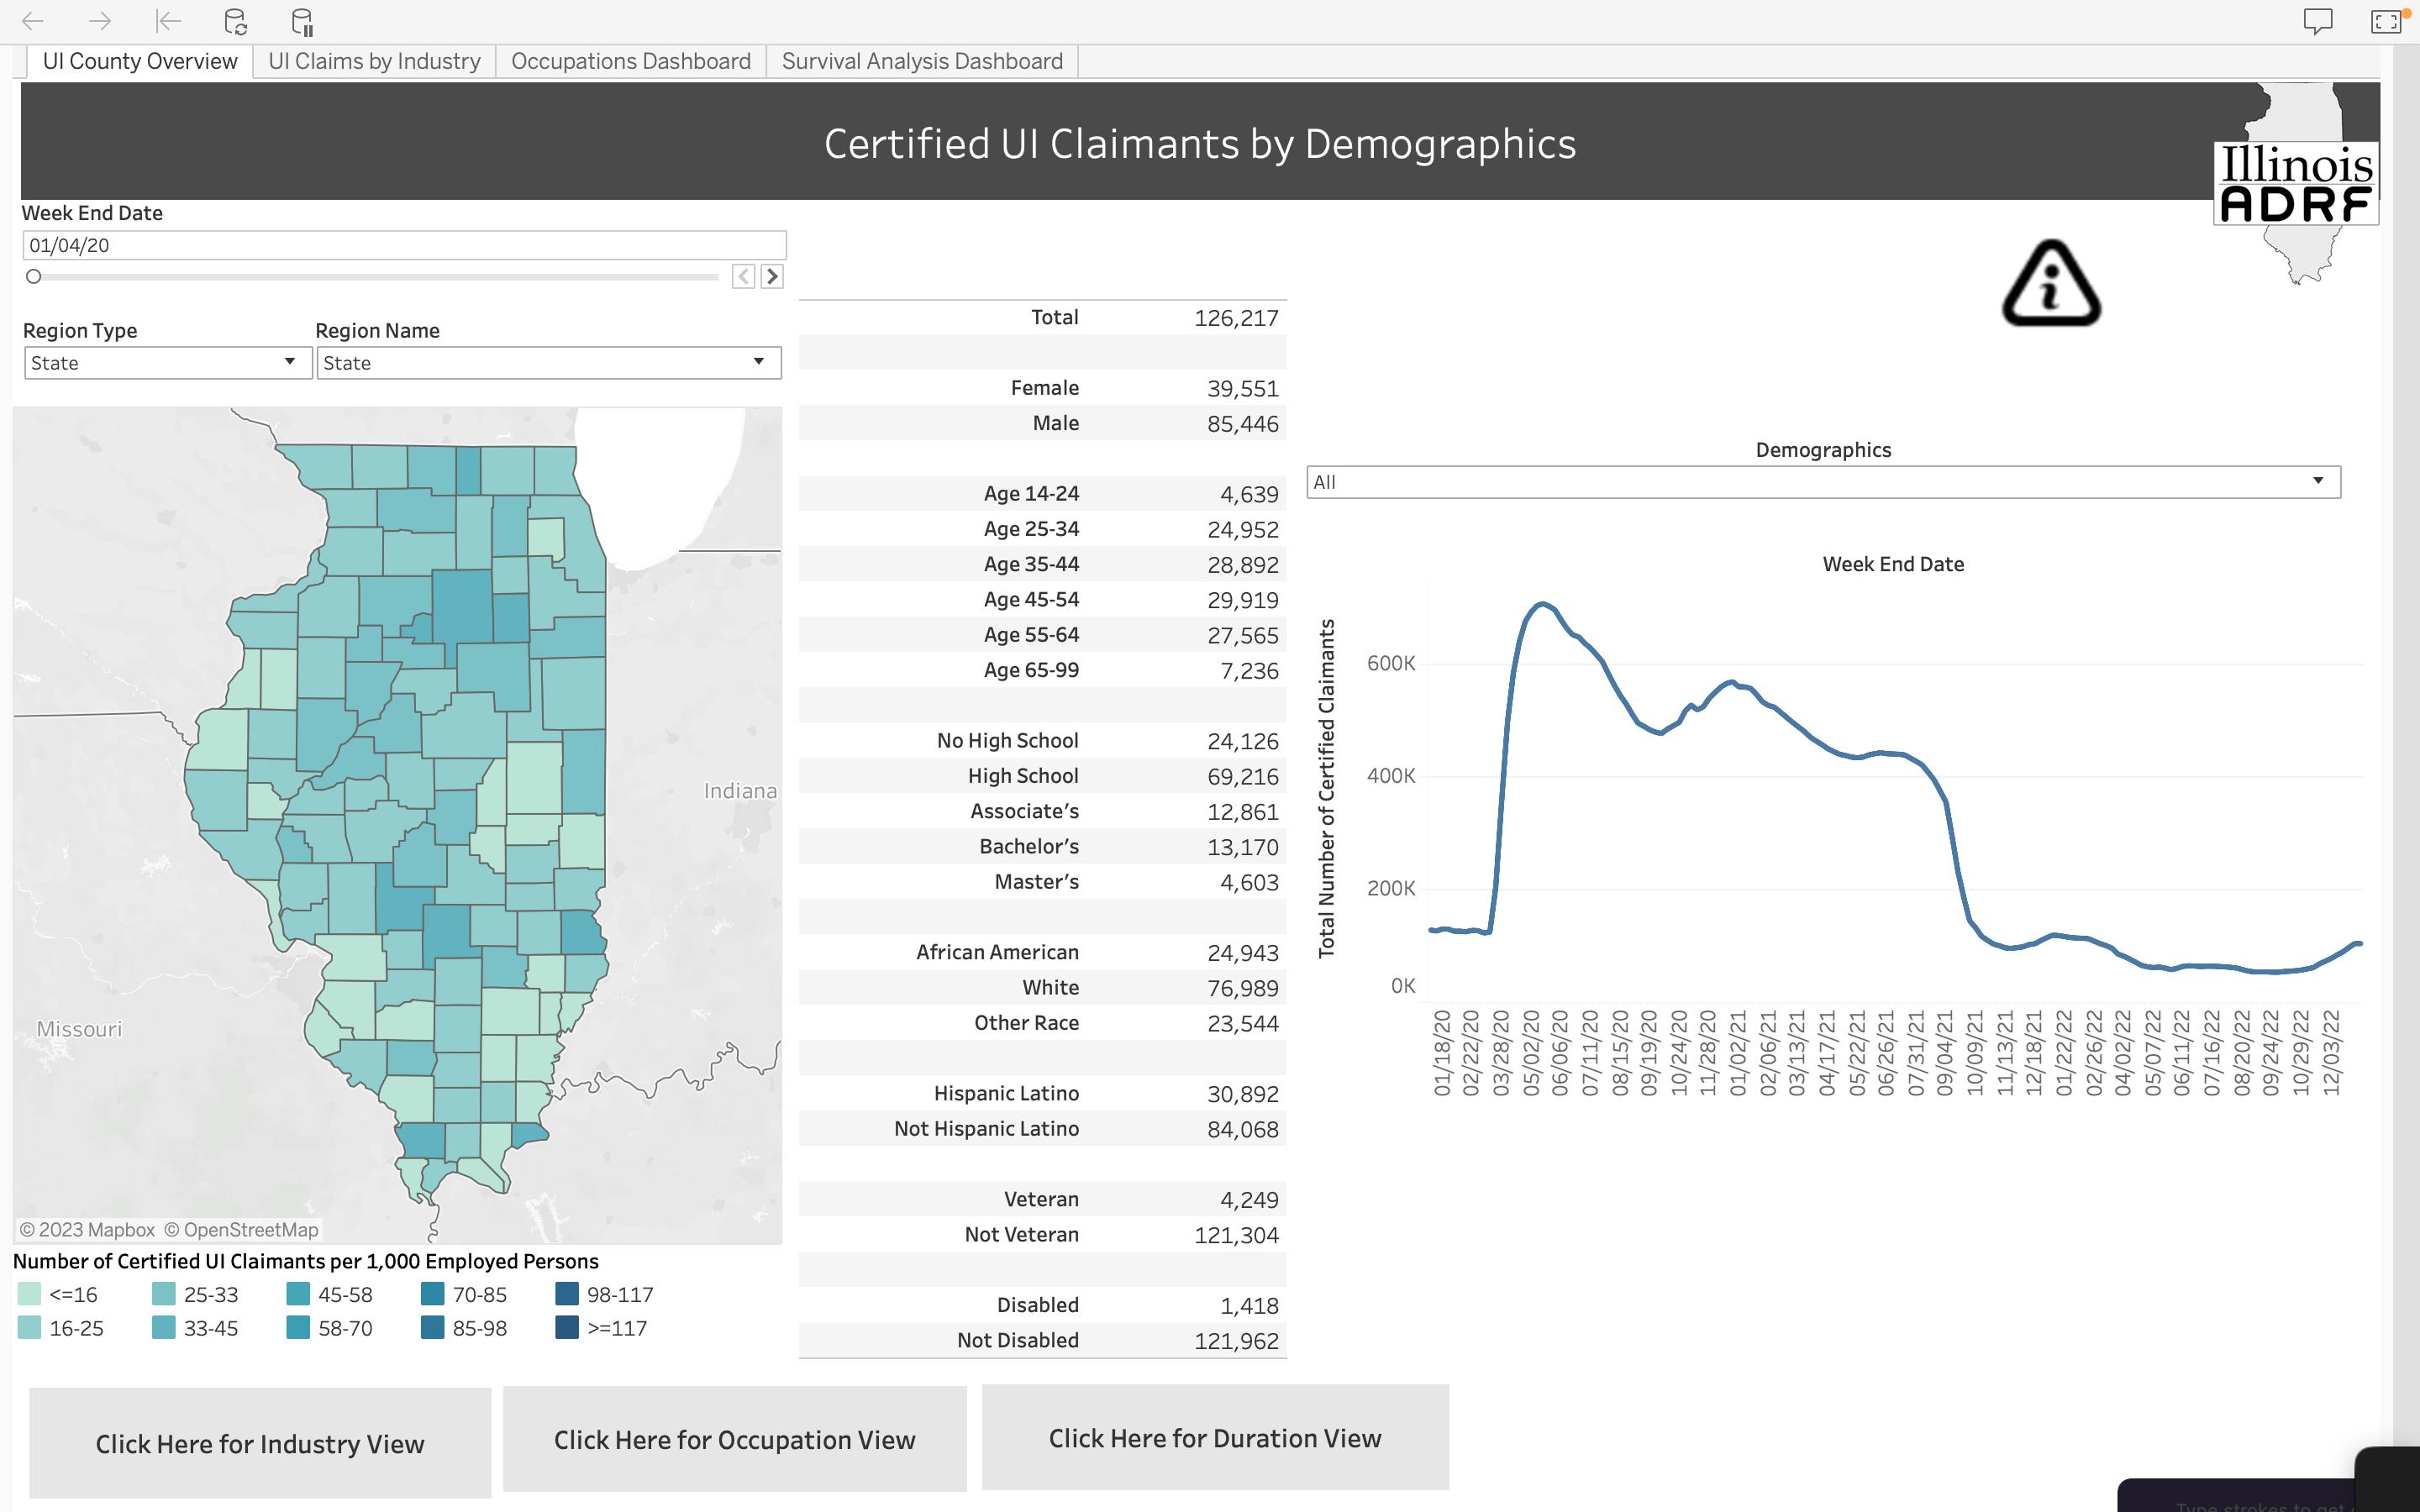
- Describe the demographic, education, industry, and occupational characteristics of Unemployment Insurance claimants.
One example is how the mining industry is hit during the Covid. As seen from the graphs above, on May 2nd, 2020, the mining industry in Southeast Illinois was hit severely by the COVID-19 pandemic, however, the effects of the pandemic don’t stop where the state border ends. The mining industry was also hit in Southwest Indiana. Putting the visualizations side by side gives a better sense of the issue as a whole for policy-makers.